USING ANSYSŪ BASED ALUMINUM REDUCTION CELL ENERGY BALANCE MODELS TO ASSIST EFFORTS TO INCREASE LAURALCO´S SMELTER PRODUCTIVITY

Marc Dupuis GéniSim Inc. 3111 Alger St., Jonquière, Québec, Canada G7S 2M9
Claude Fradet Lauralco Inc. 1 des Sources Blvd, Deschambault, Québec, Canada G0A 1S0

Abstract

State of the art ANSYSŪ based aluminum reduction cell energy balance models have been successfully used to assist efforts to increase Lauralco´s smelter productivity by improving cell thermo-electric design.

In this paper, the different models developed are presented and model validation efforts are described intensively. Initial smelter´s productivity improvement results are presented.

Introduction

The industrial production of metallic aluminum from alumina (aluminum oxide) is one of the most energy extensive industrial processes in operation in the US today. Furthermore, it requires a highly valuable form of energy: electricity.

That is why the US Department of Energy has prepared in collaboration with the Aluminum Association a Technology Road Map [1,2] that targets reducing the US aluminum industry energy consumption of the current average around 15 kWh/kg to the current best technology level of 13 kWh/kg within the next ten years. It also hopes to be able to achieve a target as low as 11 kWh/kg by the year 2020.

It is particularly interesting to point out in the context of this ANSYS® conference that one of the «Enabling Technologies» identify to achieve this very ambitious goal is the development of «effective mathematical models of the Hall-Héroult reduction process».

The Hall-Héroult cell

The Hall-Héroult reduction process is a very challenging process to model because it involves many different physical and chemical phenomena, not all very well understood and often interacting with each other [3]. In that context, ANSYS® with its multiphysics capabilities is strategically positioned to be selected to be at the core of a long term R&D effort. This effort will aim to develop a model of an Hall-Héroult reduction cell that address all modeling aspects of the design (thermo-electric, mechanical and magneto-hydrodynamic) and all the different interactions between these different aspects in a single unified model [4].

But we are not there yet. Since the thermo-electric aspect of the cell design is the one affecting the most the cell energy consumption, this is the aspect of the cell design that we will focus on in this paper.

As it was presented in a paper published at the TMS conference this year [5], ANSYS® has been successfully used to perform this task since the early eighties. In the view of the authors, it constitutes the instrument of choice to develop such thermo-electric cell models. This is why ANSYS® was selected to develop the models of the thermo-electric behavior of the Lauralco´s smelter operated by Alumax in Deschambault, province of Québec, Canada.


Since Lauralco´s smelter operates the most modern aluminum reduction cell technology available today, the Pechiney´s AP30 cell operating at 300 kA and around 13 kWh/kg, the models must be up to the task of being efficient tools to improve on the forefront of the current best technology available.
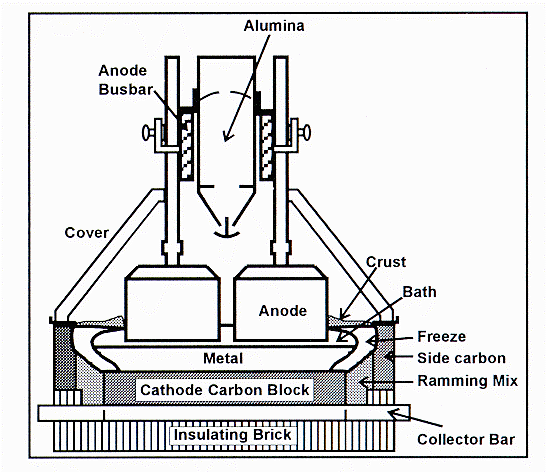
Figure 1: Schematic of an aluminum reduction cell

As we can see in Figure 1, a reduction cell consists of a steel structure called a shell lined with insulating and refractory bricks and finally a thick layer of carbon material. That carbon layer will act as the electric cathode and also as the container for the very corrosive liquid metal and electrolyte. On the top of that, hanging for what is called the cell superstructure, large blocks of carbon partially immerge in the electrolyte layer act as the cell anodes. It is important to know that the carbon anodes are consumed by the electrolysis process and are for that reason manufactured on site and constantly replaced. These anodes, as the cathode cell lining material, must also perform the task of providing thermal insulation since the process must be carried out at a temperature of 960 °C.

Since the anode part of the cell is separated from the cathodic part by the hot liquids zone that does not require to be modeled, it is convenient to build separately models for the anodic and cathodic parts.

Thermo-electric half anode model

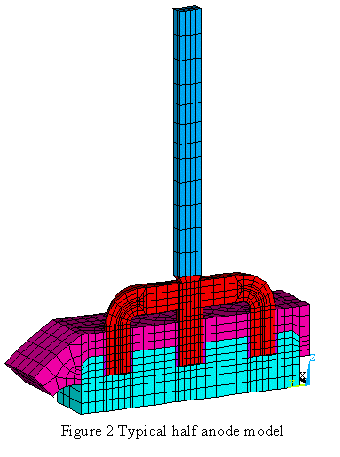
The AP30 anode design consists of a prebaked carbon block and a set of three steel studs connected together by a steel yoke. The carbon and the studs are electrically and mechanically joined together by cast iron. The steel yoke is connected to a vertical aluminum rod through a bimetallic joint.

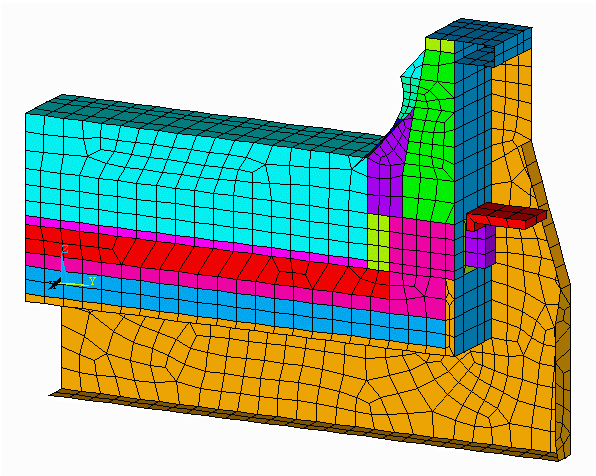
Once the new anode is put in operation in the cell, it is covered by a «crust» of mixed alumina powder and crushed frozen electrolyte to form an insulating layer above the anode. Figure 2 displays the finite element mesh of a typical half anode model.
The two key results provided by the model are:

  • the total voltage drop across the anode
  • the global heat dissipation across the anode panel
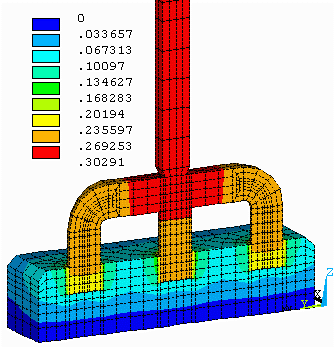

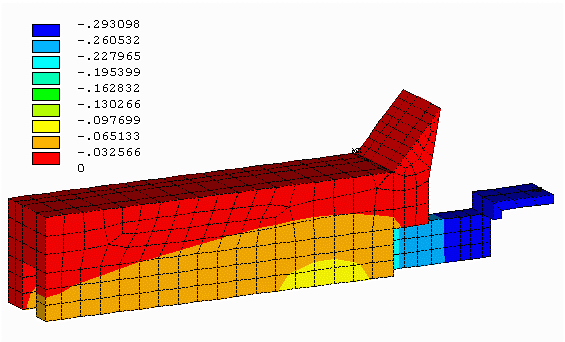
Figure 3: Voltage solution from a typical model

If the former is directly available (see Figure 3), the latter must be calculated with the use of a

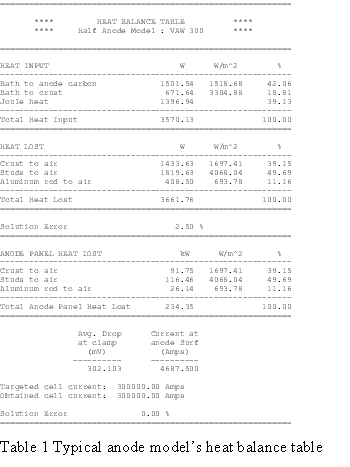
user´s macro. The result is reported under the form of a heat balance table (see Table 1).

The key challenges in producing a representative model is to characterize well the temperature dependant thermal conductivity of the crust cover material and the electrical contact resistance of the cast iron joints.

Thermo-electric cathode slice model

Contrarily to the anodic part that consists of many individual anodes, the cathodic part of the cell is one big cathode unit that rigorously could only be modeled using a quarter cathode geometry. Nevertheless, as a first step, it is very convenient to build a model that only represents the basic repetitive units of the cell lining. Figure 4 represents the mesh of a typical side slice cathode model.

Figure 4: Typical cathode side slice model

That cathode slice is made of a steel shell structure represented by shell elements, many rows of different types of lining bricks on top of which sits a thick layer of carbon material. This carbon layer is put in the cell in sections called cathode carbon blocks. To carry the current out of the cell, a steel collector bar is inserted in grooves made in the bottom face of the carbon cathode blocks. Again, cast iron is used to seal the joint between the carbon blocks and the steel collector bar. The internal vertical walls are made of either carbon side blocks or silicone carbide side blocks.


Finally, all the construction joints between the different blocks are filled with a carbon ramming paste.

Again, the two key results provided by the model are:

  • the total voltage drop across the carbon lining (see Figure 5)
  • the global heat dissipation across the cathode

Figure 5: Voltage solution from a typical model

And again, the global heat dissipation must be calculated with the use of a user´s macro. Yet this time, the calculation involves the extrapolation of the center section results into the full cathode e.g. it must incorporate into the calculation the effect of the end wall and corner heat losses. This is achieved by asking the user to provide an extrapolation factor to account for those extra losses (see Table 2).

This time the greatest modeling challenge involves the calculation as part of the model solution of the thickness of the frozen layer of electrolyte that forms on the internal walls of the cathode. This problem is tackled by another user´s defined macro that performs multiple solutions by iterating between the preprocessing phase and the postprocessing phase until the shape of the ledge layer is compatible with both the melting surface temperature and the melting heat flux boundary conditions [6].

As additional modeling challenges, since the cathode also involves cast iron electrical joints, the electrical contact resistance property of these joints must also be characterized. Finally, since the brick layer materials will be exposed to chemical attack from the electrolyte constituents, the thermal conductivity of those materials must be adjusted to account for their chemical degradation.


Thermo-electric quarter cathode model

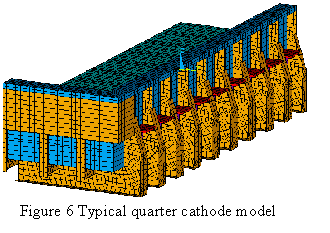
By far the biggest challenge of expanding the side slice cathode model toward a quarter cathode model is building the corner geometry of the model (see Figure 6). Obviously, once the model is built, one needs a big enough computer to be able to solve it!

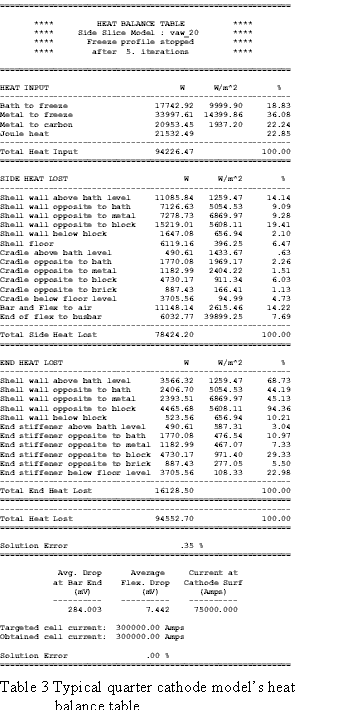
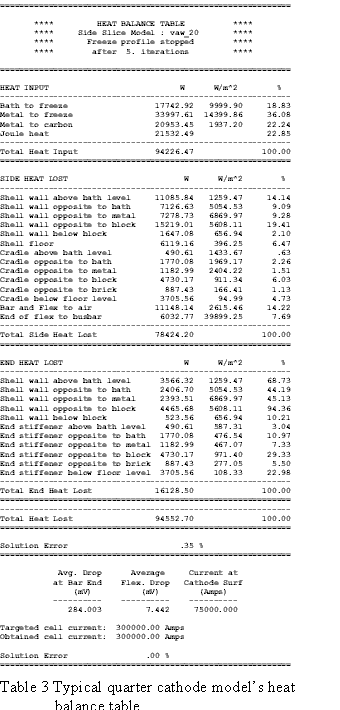
Yet, having a quarter cathode model available increases greatly the accuracy of the cathode heat dissipation predictions over the cathode side slice model since it removes the need to estimate the end wall dissipation by an extrapolation factor [7] (see Table 3).

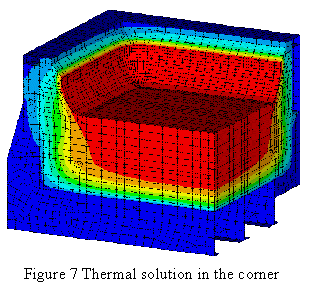
It obviously also provides additional information on the detailed end wall and corner thermal solution and ledge thickness, information quite

valuable to help improve the thermal design of the cathode in these regions (see Figure 7).

Validation of the model results

It goes without saying that the accuracy of the model results must be ascertained before the models can be used to evaluate potential design improvements in a retrofit project study. This is especially important in the present case, since the


starting point is the best technology presently available. In that context, the margin of error is quite small so the model must be very accurate.

So, the validation phase of the model development is critical to the future success of the model applications. Often, the model validation requirements make one realize how little he knows of the operational conditions of the process he currently operates. Typically, getting the plant´s operational condition data required to validate a model is more expensive than building the model itself. This was no doubt the case here.

Thermal blitz

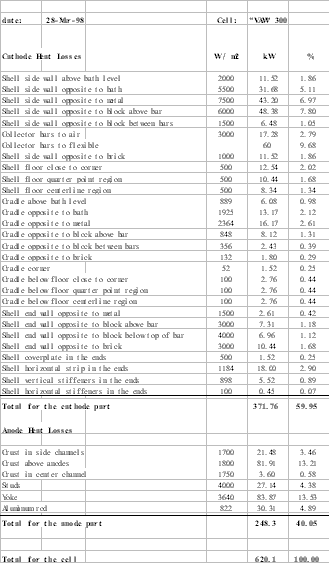
To assess the current global heat balance of the process, one needs to carry a coordinated «thermal blitz». Essentially, a «thermal blitz» is a race to measure enough heat fluxes around the cell to be able to integrate them all into a snapshot of the global cell heat losses.

Table 4: Typical measurement sheet

Table 4 presents a typical measurement sheet of a thermal blitz similar to those carried out at Lauralco´s smelter in order to provide the data to validate the models. Table 5 shows typical results obtained out of a thermal blitz exercise: the experimental heat balance table in the same format as the one produced by the model for easy comparisons.

Table 5: Typical «thermal blitz» results

At the same time, voltage measurements are made to estimate the amount of heat actually produced by the cell. If the heat losses measured match the heat produced within a few percents, the measured data are good for the model calibration exercise.

When it is time to calibrate the model, one can only adjust two things: the model boundary conditions and the materials properties. The


boundary conditions are normally assessed easily since it is not much more work to measure the ambient conditions of the cell when a thermal blitz is carried out. This fixes more or less the situation as far as the boundary conditions are concerned. This leaves the serious adjustments of the model behavior in the hands of the material properties definition.

Instrumented cathode lining

To do those material properties adjustments, getting more information on what is happening in the lining is of great help.

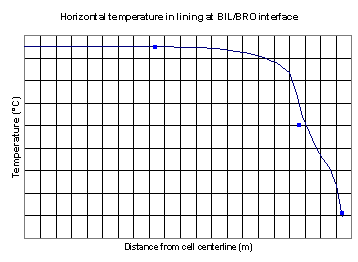
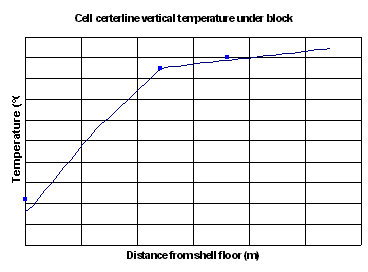
It is not uncommon to have to degrade a brick thermal conductivity property by a factor of two in order to be able to reproduce in the model the temperature measured by thermocouples installed in the cathode lining (see Figures 8 and 9).

Figure 8: Cathode lining temperature comparison

Figure 9: Cathode lining temperature comparison

It is obviously better to take brick samples during pot autopsy to have the degradation of the brick property confirmed by lab tests.

Instrumented anode

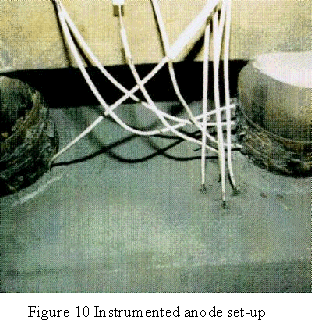
For the same reasons, it is very convenient to put thermocouples in an anode and compare thermal gradients measured by thermocouples with those predicted by the model.

What is even more important is to take advantage of the steel thermocouple sheath to also use it as a voltage probe (see Figure 10).

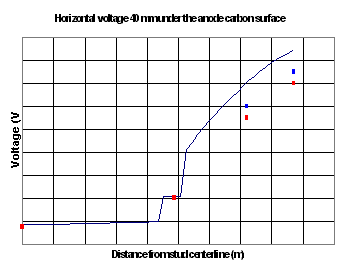
Figure 11: Anode stud voltage drop comparison


By distributing voltage probes in the carbon and cast iron around studs in addition to a reference probe located in the studs themselves, it is possible to establish experimentally the value of the contact resistance in the cast iron joints. By having defined in the model the proper contact resistances, the model can do a good job in reproducing the experimental voltage drop around the studs (see Figure 11).

Initial smelter´s productivity improvement

Once the model has been properly calibrated to reproduce the current thermo-electric behavior of the cell within a few percents, it can be considered validated. Notice that all the changes made to the material properties during the calibration must be eventually backed up by lab test measurements. The idea is not to simply introduce «fudging factors» in the model that will only work for the current situation.

A well-calibrated model should be able to predict the change in the cell behavior after a design change. At Lauralco, the first design change to increase the smelter productivity was done in 1997 by increasing the line amperage by 15 kA up to 315 kA at the same time the models were being developed.

Once validated for the initial cell amperage, the models were used to «predict» the performance of the new operating conditions with success.

By passing this test, the credibility of the model was insured, leading the way to studying further cell productivity increase to 325 kA.

Conclusions

The models represent for Lauralco powerful tools to pursue the development of the technology. It will accelerate the optimisation process and minimise trials and errors.

Moreover, the development of the models was for Lauralco a strong learning process which gave the

people involved the chance to improve their knowledge, to better understand the process and its limits. It was a work that requested a lot of efforts. Hoewever, we get today the fruits of these efforts.

Acknowledgements

The autors would like to acknowledge the contribution of the following persons to the success of the Lauralco´s models development : Jose Chermanne, Daniel Richard and Réjean Simoneau.

References

  1. Aluminum Technology roadmap Workshop (Washington, D.C.: Aluminum assoc., 1997).
  2. H.S. Kenchington, J.L. Eisenhauer and J.A.S. Green, «A Technology Roadmap for the U.S. Aluminum Industry», JOM, (August 1997), 18-21.
  3. M. Dupuis, «Process Simulation», TMS Course on Industrial Aluminum Electrolysis, (1997).
  4. I. Tabsh and M. Dupuis, «Modeling of Aluminum Reduction Cells Using Finite Element Analysis Techniques», Light Metals, (1995), 295-299.
  5. M. Dupuis, «Computation of Aluminum reduction Cell Energy Balance Using ANSYS® Finite Element Models», Light Metals, (1998).
  6. M. Dupuis and I. Tabsh, «Thermo-electric Coupled Field Analysis of Aluminum Reduction Cells using the ANSYS® Parametric Design Language», Proceeding of the ANSYS® Fifth International Conference, volume 3, 17.80-17.92, (1991).
  7. M. Dupuis and I. Tabsh, «Thermo-electric Analysis of the Grande-Baie Aluminum reduction cell», Light Metals, (1994), 339-342.