DEMONSTRATION THERMO-ELECTRIC AND MHD MATHEMATICAL MODELS OF A 500 KA ALUMINUM ELECTROLYSIS CELL: PART 2

Marc Dupuis*, Valdis Bojarevics** and Janis Freibergs***

*GéniSim Inc
3111 Alger St.,Jonquière, Québec, Canada, G7S 2M9


**University of Greenwich, School of Computing and Mathematics
30 Park Row, London, SE10 9LS, UK
V.Bojarevics@gre.ac.uk

***University of Latvia, Institute of Physics
32 Miera St., Salaspils, 2169, Latvia
JF@sal.lv

Abstract

In the present study, a full 3D cell-cathode thermo-electric model of a 500 kA demonstration cell has been developed.

In parallel, a non-linear transient wave MHD model for the same 500 kA demonstration cell, taking into account the shielding effect of the optimized geometry of the potshell, has been developed.

Preliminary results of the impact of the interactions between the cell thermo-electric and MHD models are presented.

Introduction

In Part 1 of this collaborative work, the authors developed both a 3D quarter-cell thermo-electric model and a non-linear wave MHD model of a 500 kA demonstration cell design [1]. The quarter-cell model comprises one quarter of the cell with cathode and anode linked together. The other three quarters of the cell are present by virtue of symmetry. For details on the design of this 500 kA cell, see the article published in the magazine Aluminium last year [2].

The present collaborative work is also a direct follow-up of the work presented in 2002 on the tentative development of a 3D full-cell and external bus-bar thermo-electric model [3]. At that time, a model of a 300 kA demonstration cell design was built but could not be solved on the PIII computer then available.

The need to link together a 3D full-cell thermo-electric model and the non-linear wave MHD model into a coupled thermo-electric-MHD model of an aluminum electrolysis cell has already been explained in details previously [4]. The ultimate goal of the current collaborative work is to develop such a coupled thermo-electric-MHD model which would be one of the steps towards the development of a complete multi-physics model of an aluminum electrolysis cell.

In this paper, the results of a 3D full-cathode and external bus-bar thermo-electric model are presented. Attempts to calculate thermo-electric fields in a full-cell and a half-cell model are also discussed. A full-cell model is essentially a full-cathode model with the anode coupled to it. A half-cell model is one half of the full-cell model, the other half is present by virtue of symmetry.

The non-linear wave MHD model is extended to take into account the shielding effect of the detailed and optimized geometry of the potshell. Finally, the velocity fields calculated in the MHD model are used to define the metal/ledge and bath/ledge local heat transfer coefficients in the thermo-electric model.

3D full-cathode and external bus-bar thermo-electric model

As demonstrated in [5], in the first approximation, it is not necessary to model in detail the anode panel in order to calculate the current density in the metal pad when all the anodes are carrying nearly equal current. The position of the ledge, the geometry of the block/collector bar connection and the external bus-bar design all have more influence on the metal pad current density than small resistance discrepancy in the anode network. Hence the 3D full-cathode and external bus-bar thermo-electric model is sufficient to compute the detailed current density in the metal.

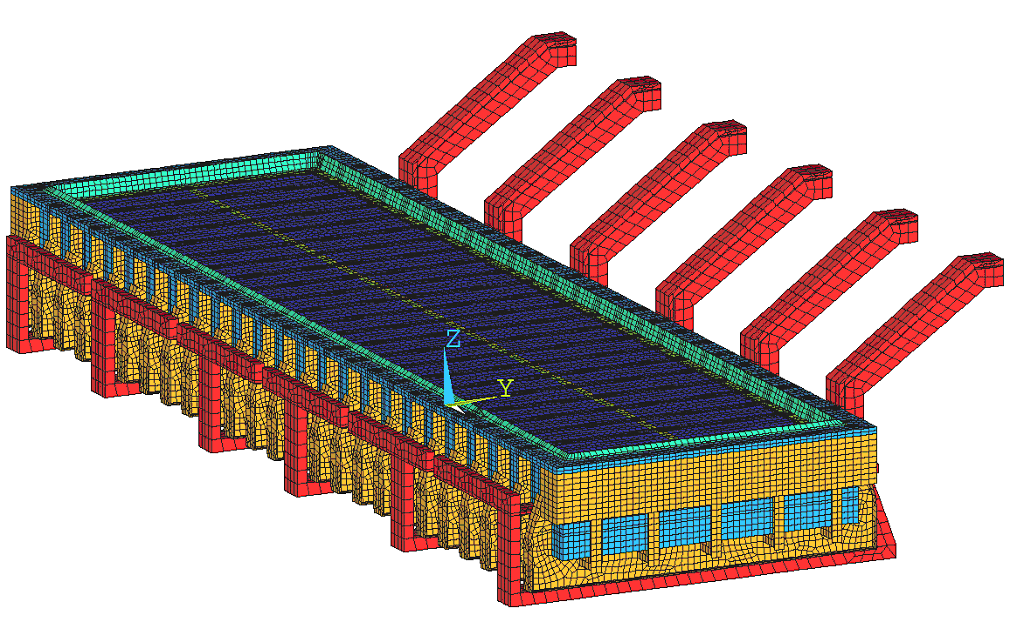
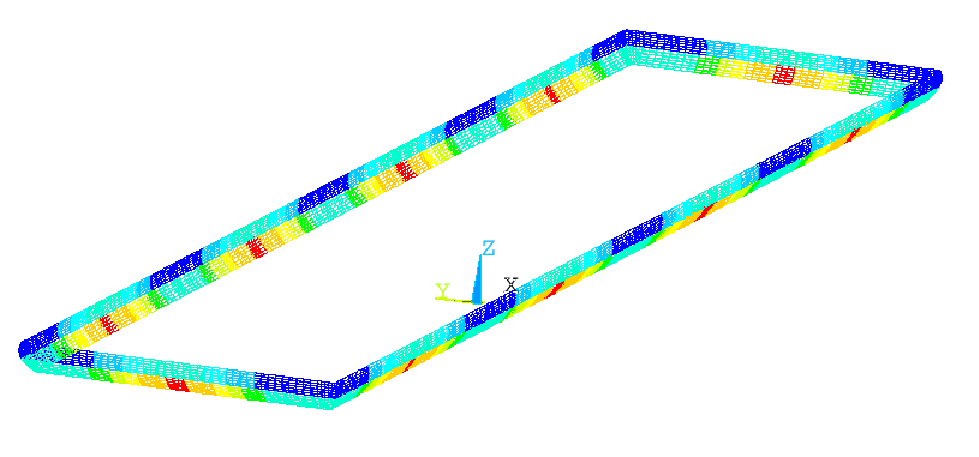
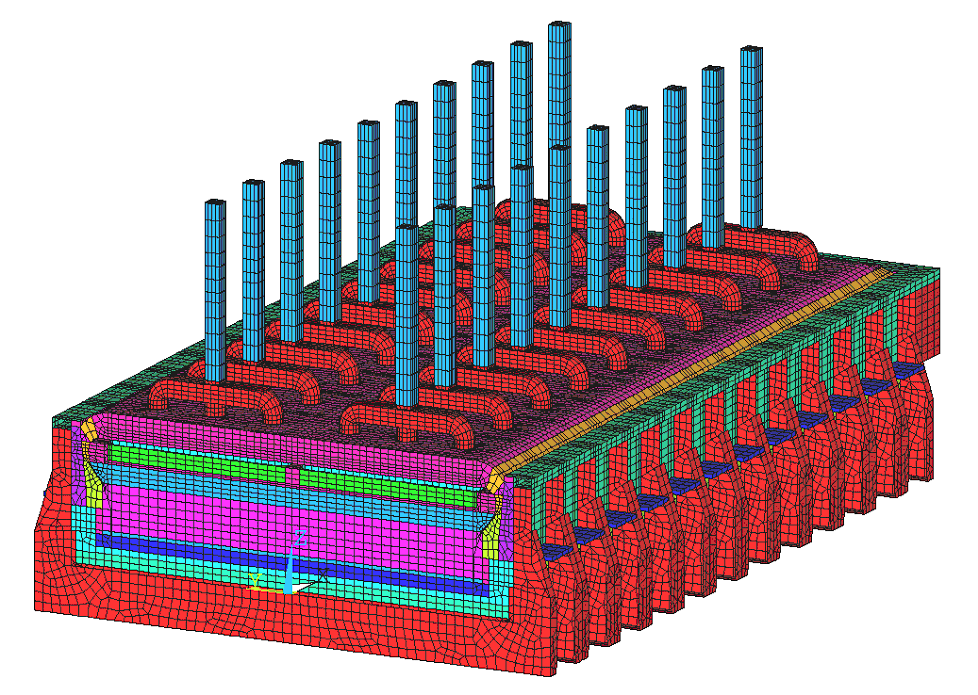
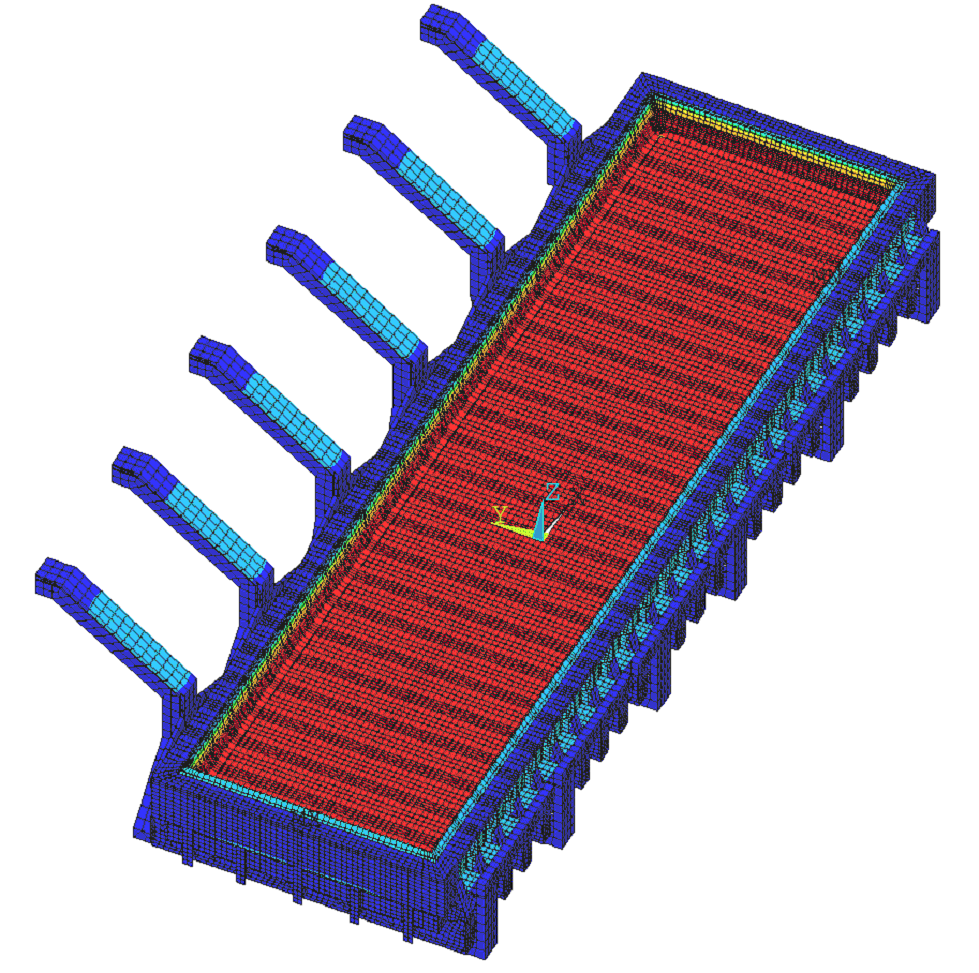
Figure 1 shows the mesh of the 3D full-cathode and external bus-bar thermo-electric model. For the 500 kA demonstration cell, the mesh is made of 354116 finite elements. Figure 2 shows the distribution of the local heat transfer coefficients at the metal/ledge and bath/ledge interface for the preliminary run. This distribution is not based on the velocity fields calculated by the MHD model or any other velocity field. It is rather arbitrarily generated by a sinusoidal function, which gives a variation along the walls, similar to what four flow pools would give.

A P4 3.2 GHz computer was used to compute the solution. It took 17 CPU hours to solve the model in order to perform 3 loops of the ledge shape convergence scheme. The convergence scheme was stopped before reaching convergence, as this was not required for this preliminary run.

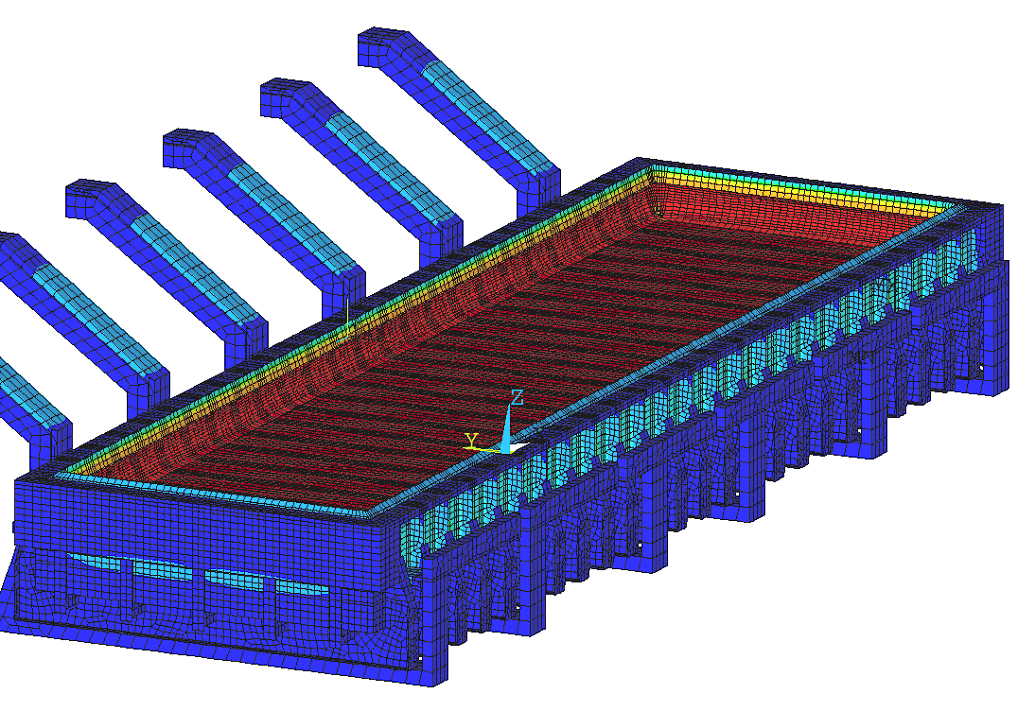
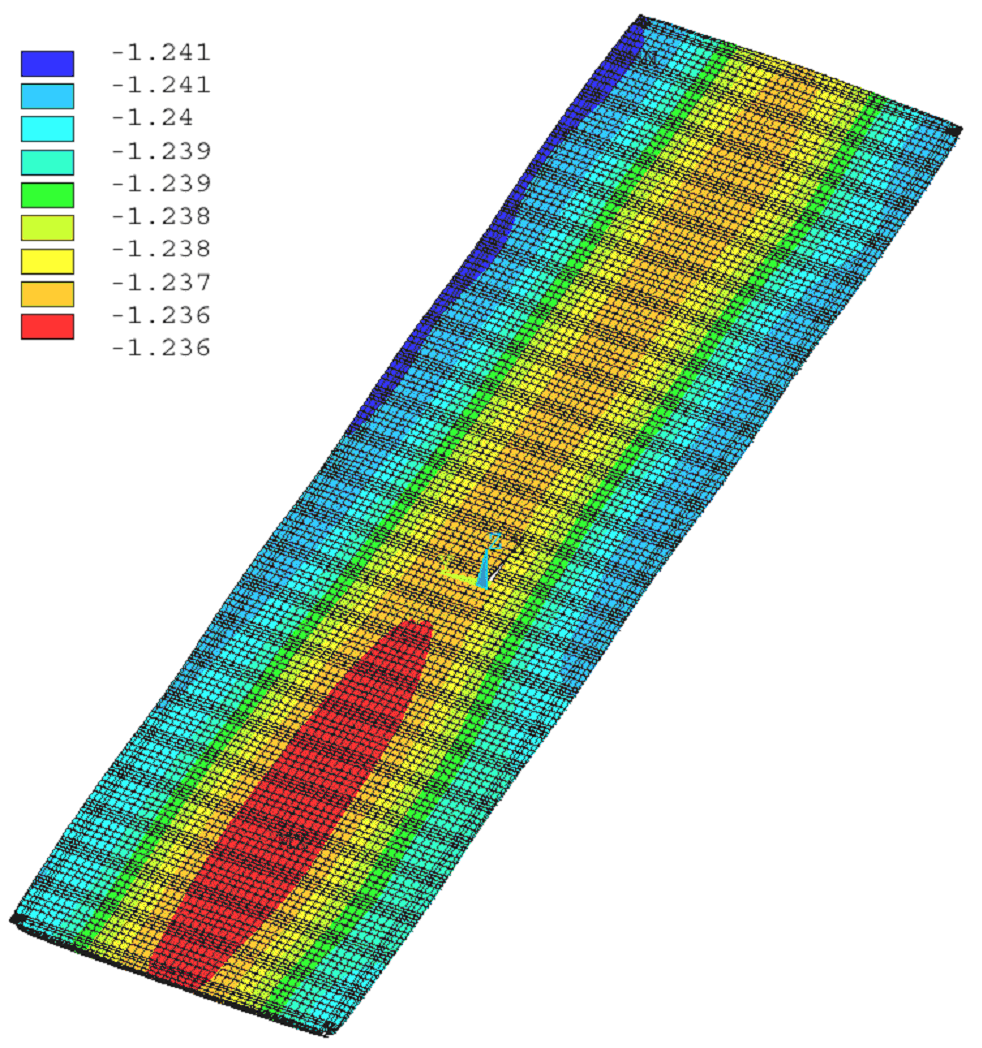
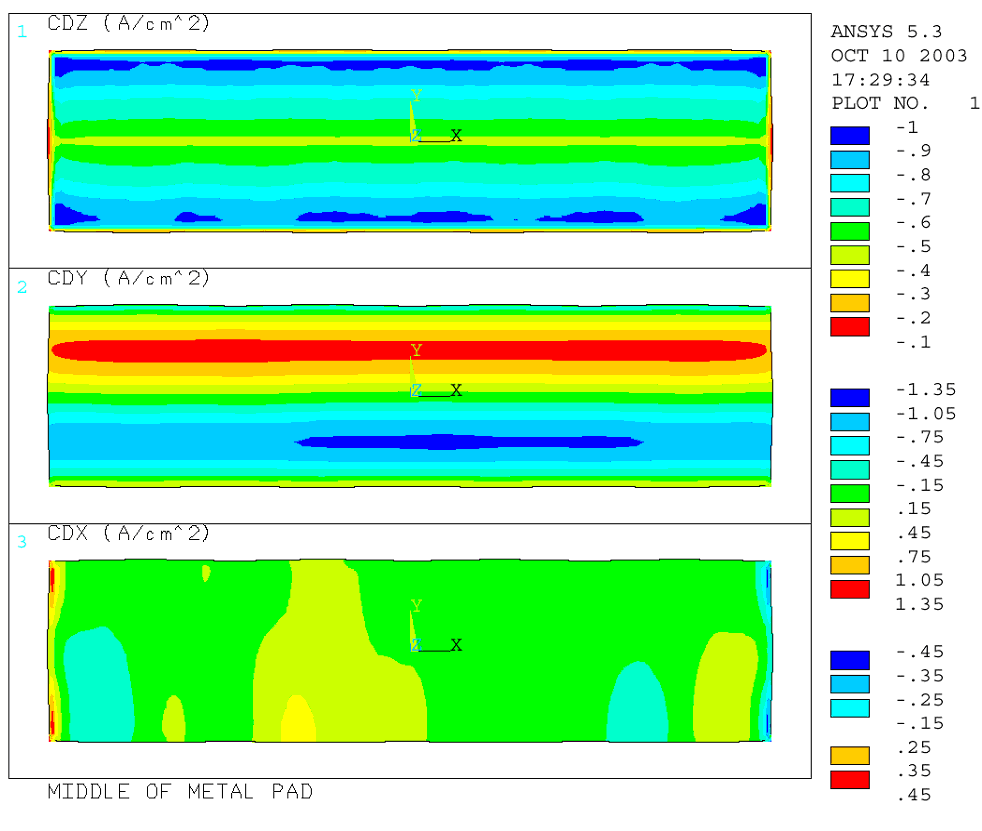
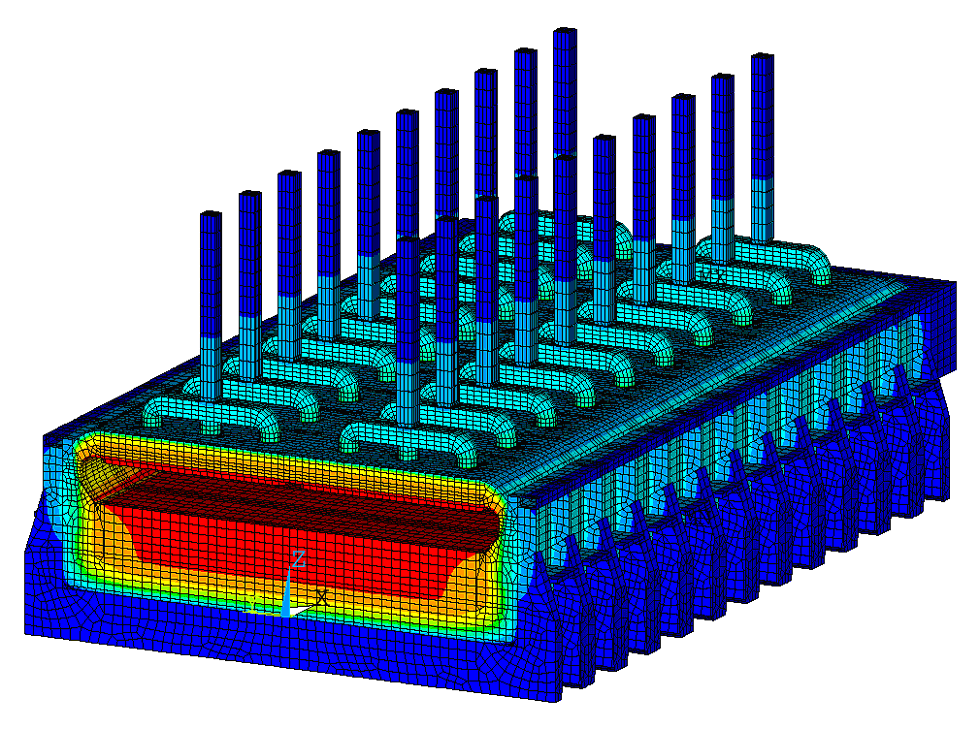
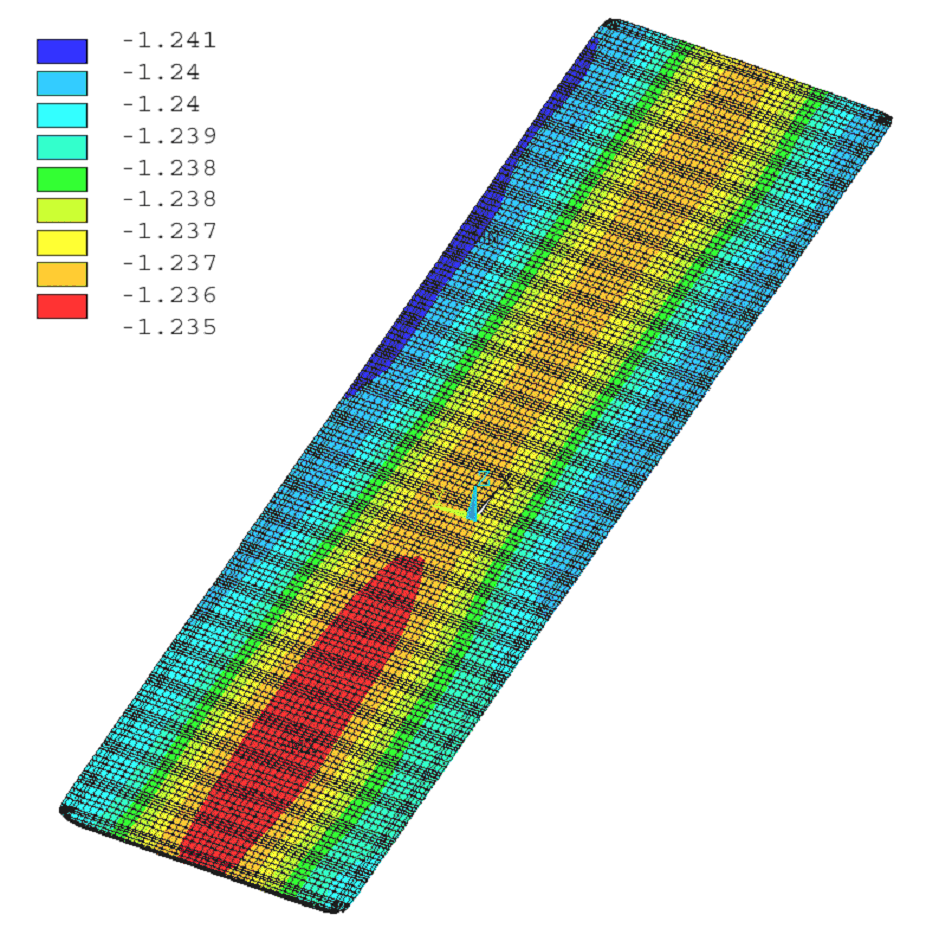
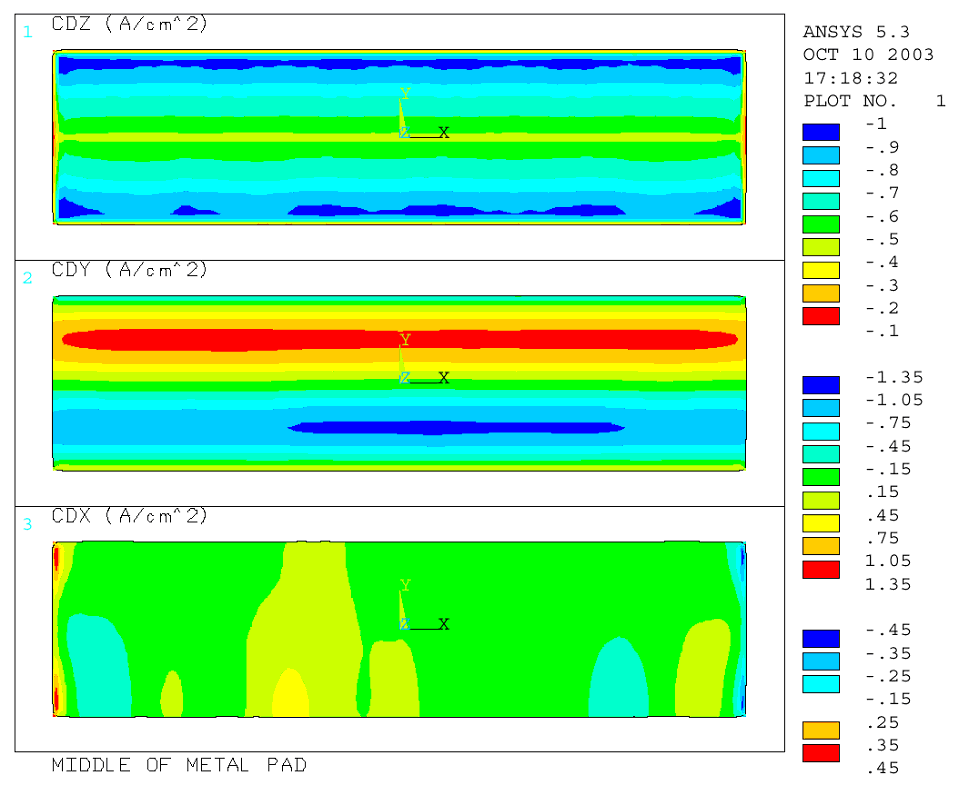
Figure 3 shows the obtained thermal solution, while Figures 4 and 5 show the metal pad voltage solution and the metal pad current density, respectively. It can be observed that the resulting ledge profile thickness varies along the cell perimeter: the ledge is thicker where the local heat transfer coefficient was set low and thinner where the local heat transfer coefficient was set high. As a result, the intensity of the horizontal current in the metal pad is not uniform along the cell but rather varies from cathode block to cathode block depending particularly on the ledge toe variation along the cell perimeter.


Figure 1: Mesh of the 3D full-cathode and external bus-bar thermo-electric model.

Figure 2: Setup of the local heat transfer coefficients pattern at the liquids/ledge interface.

Figure 3: Thermal solution of the 3D full-cell cathode and external bus-bar thermo-electric model.

Figure 4: Voltage solution in the metal pad of the 3D full -cathode and external bus-bar thermo-electric model.

Figure 5: Current density in the metal pad of the 3D full- cathode and external bus-bar thermo-electric model.


3D full-cell and external bus-bar thermo-electric model

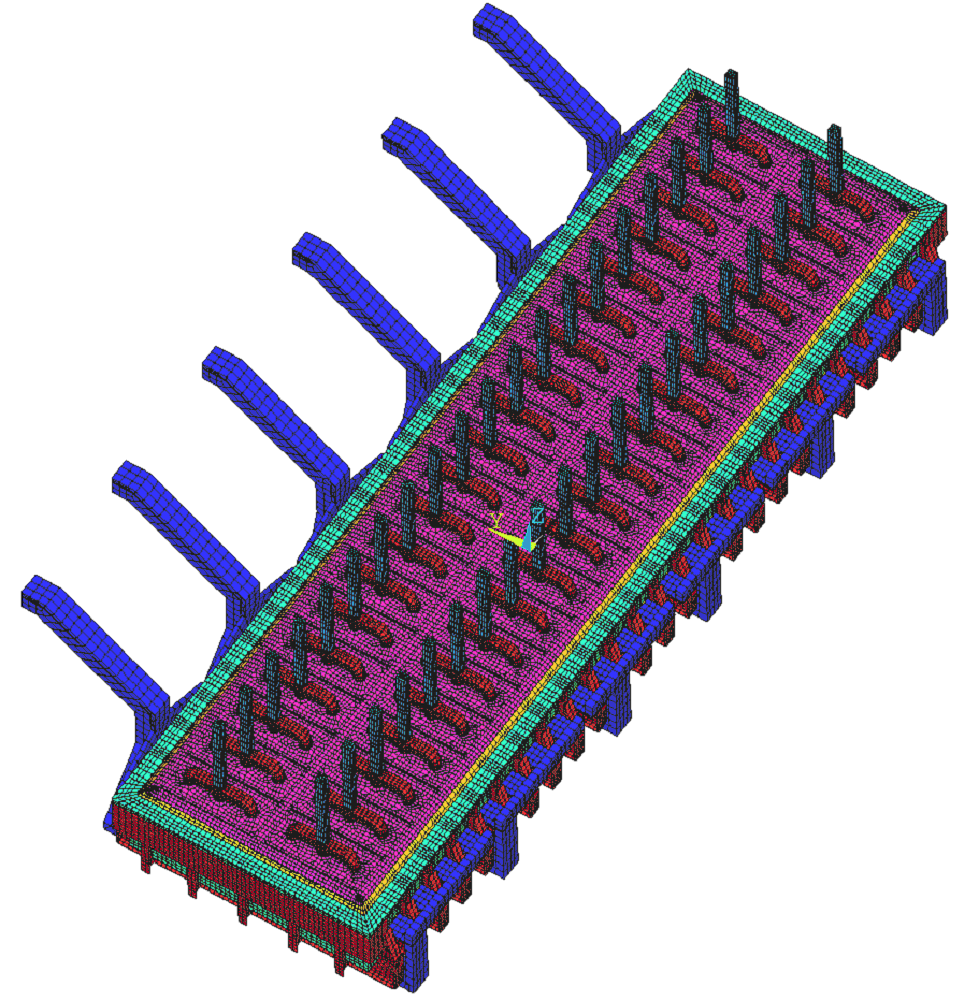
Figure 6 shows the mesh of the 3D full-cell and external bus-bar thermo-electric model. That mesh is made of 585016 finite elements. Once again [3], that model could not be solved even on the more powerful P4 3.2 GHz computer with 2 GB of RAM. Unfortunately, that model is using constraint equations to connect the anode panel mesh to the cathode mesh, and it seems that those constraint equations are preventing the ANSYS solver to converge. However, it is worth noting that the authors are still using a 10 years old version of ANSYS and it is hoped that improvements made to the ANSYS solver since then will ensure convergence.


Figure 6: Mesh of the 3D full-cell and external bus-bar thermo-electric model.


Figure 7: Mesh of the 3D half-cell model.

3D half-cell thermo-electric model

Figure 7 presents the mesh of a 3D half-cell model. This mesh is made of 290410 finite elements. That model is the biggest model with constraint equations that could be solved. The P4 took 100 CPU hours to converge with the assumed ledge profile. Figure 8 shows the thermal solution obtained. Of course, with that much CPU time required for an assumed ledge profile, it was not practical to repeat this 5 - 10 times, the number of iterations needed for the calculation of the ledge profile!

Figure 8: Temperature solution of the 3D half-cell model.

MHD model refinement

Magnetic field in an aluminium cell is created by the currents in the cell itself and from the complex bus-bar arrangement around the cell, in the neighboring cells and the return line, and by the effect of cell construction steel magnetization. The magnitude and distribution of the magnetic field is of prime importance for maintaining a desirable gentle mixing in metal and bath and to avoid unstable wave growth with the intense flow and associated wall erosion. The complexity of any practically usable magnetohydrodynamic (MHD) model of the cell arises from the coupling of the various physical effects: fluid dynamics, electric current distribution, magnetic field and thermal field.

The MHD model presented here accounts for the time dependent coupling of the current and magnetic fields with the bath-metal interface movement [6]. Ledge profile is assumed given for now. Coupling with the thermal model, which will supply ledge profile to the MHD model, will be made in near future. This model calculates non-linear waves and turbulent flows in the two liquid layers. The fluid flow and wave model is transient and effectively three-dimensional, using for the metal and bath flow the shallow-layer approximation. The model couples the waves and the electromagnetic field distribution; both, electric and magnetic fields are recalculated as the wave shape changes. Although it has been validated against analytical solutions for nonlinear gravity waves and against physical models with mercury in the past, it has never been tested with real cells because of high cost of measurements and because involvement of an aluminium producer would be necessary. We wish that in the future, such validation could be done.

The first calculation step needed for an MHD model is the electric current distribution in the busbars. This is calculated by coupling the electric current in the fluid zone to a resistance network representing individual anodes and cathode collector bars as well as the whole bus-bar circuit between two adjacent cells. The Kirchhoff equations are generated automatically and solved at each time step in order to simulate the effect of waves on electrical current redistribution in the whole electrical circuit. The software permits adding connections, easily changing bus locations and cross-sections, giving the freedom to experiment and optimize the bus-bar network.


In the 500 kA test cell, all electrically independent cathode bus-bars are connected in 12 sections, each of which takes the current from 4 collector bars, and then the upstream and downstream counterparts are connected by 6 anode risers to the anode bus-bars. The asymmetric bus arrangement for this cell partly compensates the return line on the left at x = - 60 m. There is almost a 50 - 50% upstream - downstream current division owing to carefully adjusted bus-bar cross-sections.

The second step in the MHD model is to calculate the magnetic field B (called more precisely, magnetic induction), which is necessary to determine the electromagnetic force distribution within the liquid zone, f = j x B. The magnetic field B is the sum of two contributions: B = BI + BM ; BI is generated by currents and BM by ferromagnetic steel material. The magnetic field BI from the currents in the full bus-bar network is recalculated at each time step during the dynamic simulation using the Biot-Savart law. A very similar technique is used on the 3D grid within the cell fluid layers where a special analytical technique is applied to deal with the singularity in the Biot-Savart Law in order to obtain a smooth and converging solution when the field calculation position coincides to the electric current.

The calculation of the magnetic field BM from steel requires much more effort and cannot be done at each time step; we calculate it only once with the steady state current distribution. The difficulty arises because the steel parts of the cell are made of ferromagnetic material whose magnetization M (H) depends non-linearly on the local magnetic field intensity H in the magnetic material. The local magnetic induction B in the ferromagnetic material is orders of magnitude higher than in the non-magnetic material, like air, liquid aluminium, bath etc. Equation (1) gives the relationship between magnetic induction, magnetization and magnetic field intensity.

where µ0 is the permeability of vacuum, equal to 4p x 10-7 (H/m) in the International System of Units. In the non-magnetic material M = 0 and B = µ0 H. In the magnetic material the unknown magnetic field intensity H is related to the magnetization M (H) by the material properties of a particular material (depending also on the temperature, carbon content in steel, previous magnetization, etc.). The typical curves used for the aluminium electrolysis cells are discussed in [7]. In order to find the unknown magnetic field intensity, we need to solve the integral equation:

where the magnetic field HI is given by the Biot-Savart law from all the external electric currents, the co-ordinate location r is for the field calculation position (observation point), the integration point position r' is in the element volume dV' running through all the ferromagnetic material in Vm. The iterative solution procedure for the equation (2) starts with an assumed distribution of M in the ferromagnetic elements, calculates H for these elements, then uses M (H) material property to obtain the updated magnetization. The procedure ends when convergence is achieved. The obvious complication is due to the singularity in (2) when the integration point coincides with the observation point.

This is a very important contribution to the solution and can not be simply discarded; instead the analytical singularity elimination is used to give smooth results.

Once the magnetization of steel is known, the magnetic flux density B = µ0 H for the fluid zones can be calculated from the equation (2) using the observation location r on the computational grid where the electromagnetic force distribution is needed. This method used for magnetic field calculation was validated against mercury physical models with and without steel parts. Some validation was also carried out on commercial cells.

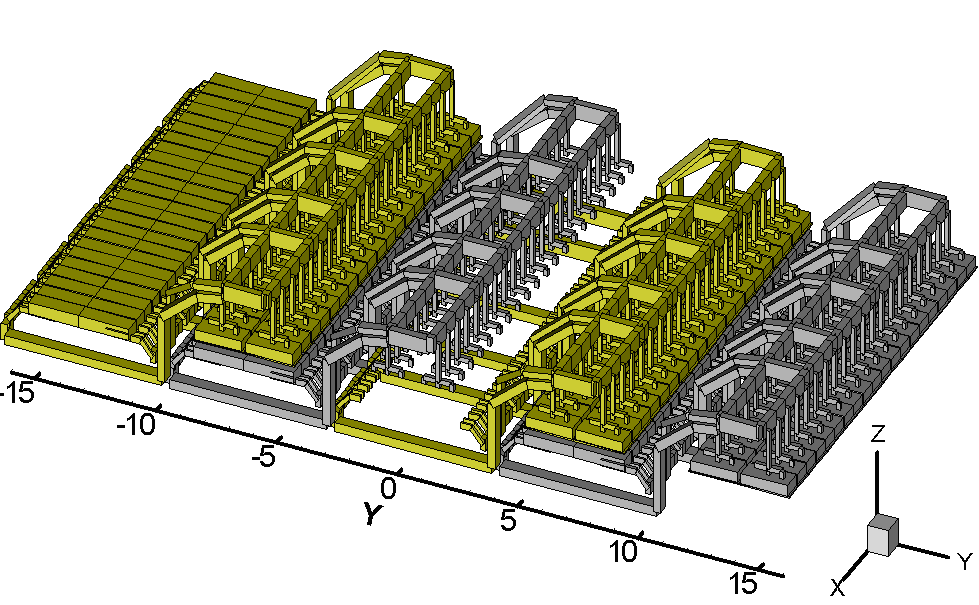
Figure 9: The experimental 500 kA bus-bar: four neighboring cells used in magnetic field calculation.

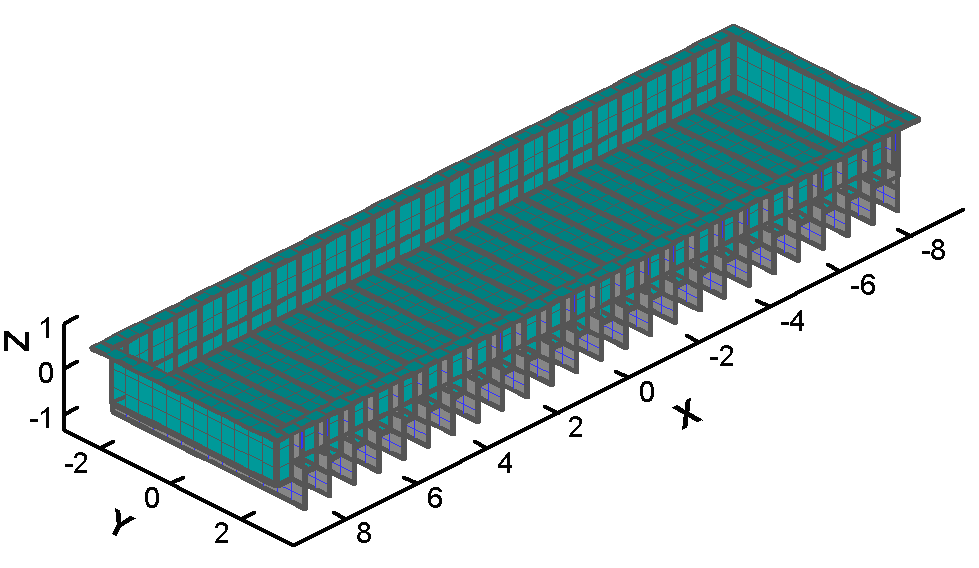
Figure 10: The ferromagnetic elements shown for the test cell.

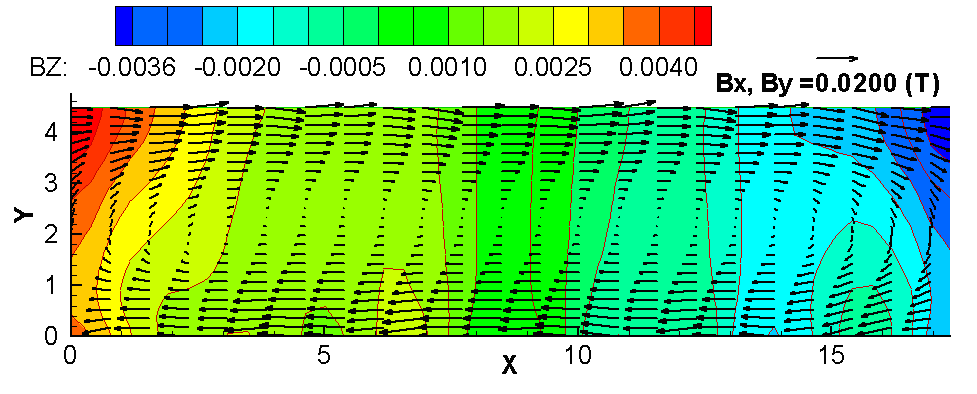
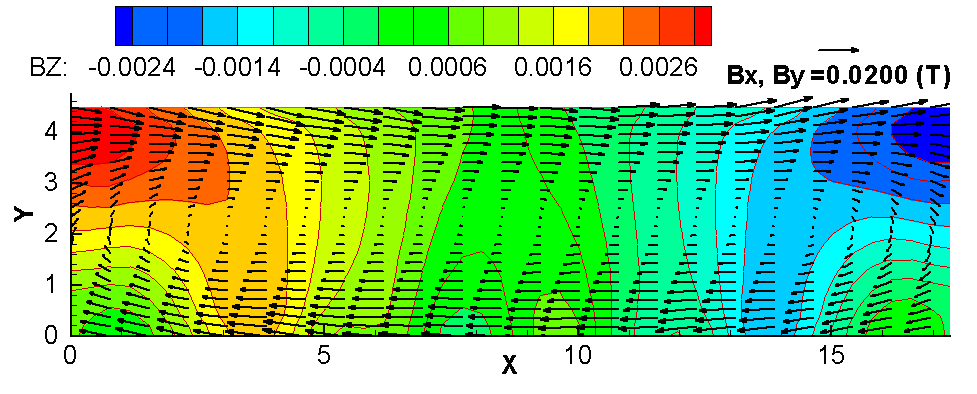
For the magnetic field computation, the busbar network was extended to include four neighboring cells as shown in Figure 9. The steel is included as shown in Figure 10. The steel was divided into approximately 30000 nonlinear elements. Figure 11 shows the magnetic field at the liquid metal top level without the effect of steel and Figure 12 - with the effect of steel. The difference between the two is considerable (see the legend in the Figures).

The MHD model uses a relatively rough mesh of 25x45x2 elements in order to be able to re-compute the current distribution at each time step in a reasonable time. Nevertheless, the solution is sufficiently smooth because of the global pseudo-spectral approximation used for the space discretisation permitting much higher accuracy in comparison to finite element or finite volume approximations on the similar grid size.


The aluminium-electrolyte interface deformation makes the anode currents unequal because of the local ACD change. The model includes an option to account for the time average gradual consumption of the anode bottom to conform to the ACD change. An artificially accelerated anode burn-out is permitted in order to achieve the result in a reasonable computational time interval.

Figure 11: The magnetic field calculated without the ferromagnetic elements.

Figure 12: The ferromagnetic elements shown for the test cell.

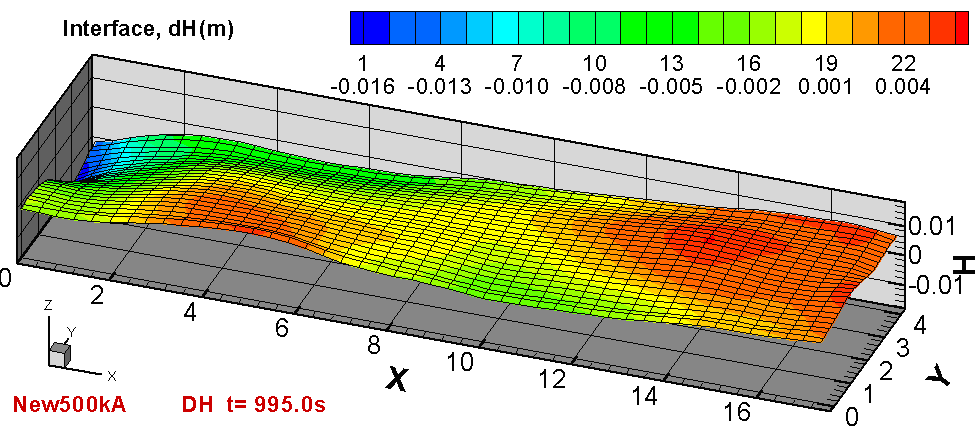
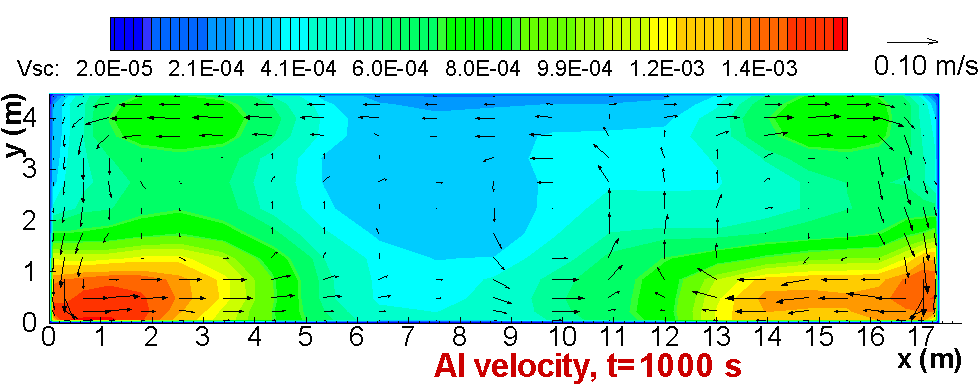
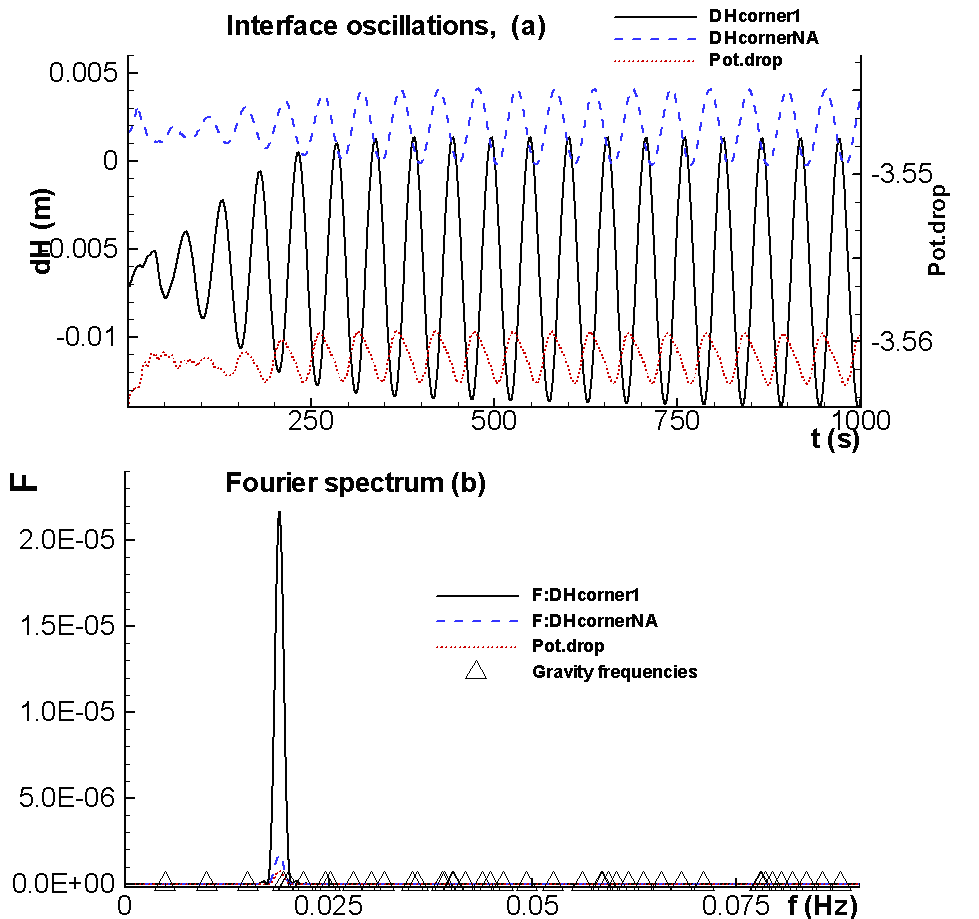
A transient MHD simulation is started with the flat metal-bath interface and zero velocity. Then the usual magneto-hydrostatic approximation is used to compute the interface deformation as it would be if the electric currents are uniform. This interface position is used as the actual initial state. A time step of 0.2 s was used in the simulation shown. The waves take about 200 - 300 s to build up to a constant amplitude as shown in Figure 15. In a stable cell, this would be the time needed to achieve a stationary interface position and a corresponding current distribution. A snapshot of the computed metal-bath interface deformation after 1000 s of simulation is shown in Figure 13. Predominantly horizontal re-circulating flow also grows gradually with time. A snapshot of the velocity patterns and the effective turbulent viscosity distribution at 1000 s is shown in Figure 14.

Figure 13: The metal-bath interface at the last time steps of the computation.

The flow is turbulent for the typical conditions of the electrolysis cell. The MHD model presented here uses 2 equation 'k-?', time dependent turbulence model [6] which is solved simultaneously with other variables at each iteration. The highly non-uniform distribution of the effective turbulent viscosity is shown by the color-filled contour lines in Figure 14. The regions of high turbulent viscosity are associated with enhanced turbulent heat and mass transport, which are important for predicting heat loss (ledge thickness) and the cell wall erosion.

Figure 14: The velocity and the effective turbulent viscosity in the liquid metal at the last time step of the computation, t=1000 s.

The coupling between pressure and velocities has some special effects on the metal-bath interface deformation. A large scale horizontal vortex will create a considerable free surface dip in its center. This is because the circulation pattern in the metal layer is different from the one in electrolyte; this creates pressure differences across the interface to which the interface adjusts vertically. The other important effect included in the MHD model is the flow-induced electric current, resulting from the term s v x B (s is the electrical conductivity, which is very high for liquid metal, v - metal velocity). This effect usually stabilizes the cell fluid dynamics because, according to the Lenz's law, the induced field always acts against the mechanical action causing it.

Figure 15: The computed metal-bath interface oscillations at two diagonally opposite corners (under anode N1 and anode N40) and the voltage oscillation (a); and the corresponding Fourier spectra shown with the typical gravity frequencies (triangles) for comparison (b).


The oscillation patterns beneath the first corner anode and the diagonally opposite far corner anode are shown in the top part of the Figure 15. The respective anode currents fluctuate in the same manner. In spite of fairly nice and symmetric circulation patterns, shown in Figure 14 for the metal (and a different 4 vortex pattern in the bath, not shown here), the wave is not damped as would be expected in a stable cell; the oscillations remain at about 1 cm amplitude above and below the initial flat surface. This also gives rise to the cell voltage oscillations of a magnitude about 3 mV which are shown in Figure 15. They are the result of the overall cell resistance change, caused by the non-uniform ACD changes during the wave motion. The voltage noise is typically observed in all commercial cells. This particular 500 kA demonstration cell, evidently, will need a further busbar optimization to make the cell more stable. Reducing the magnetic field magnitude at the downstream left corner would certainly help. We are not particularly concerned about this here, because the purpose of this article is to present the model and not to design a commercial bus-bar arrangement. The Fourier spectrum for this oscillation indicates a dominant frequency between the third and fourth gravitational frequencies in the full spectrum of the normal gravity waves. As explained in [8], the MHD interaction is responsible for the shift from the purely hydrodynamic oscillation frequencies.

First interaction trial between models

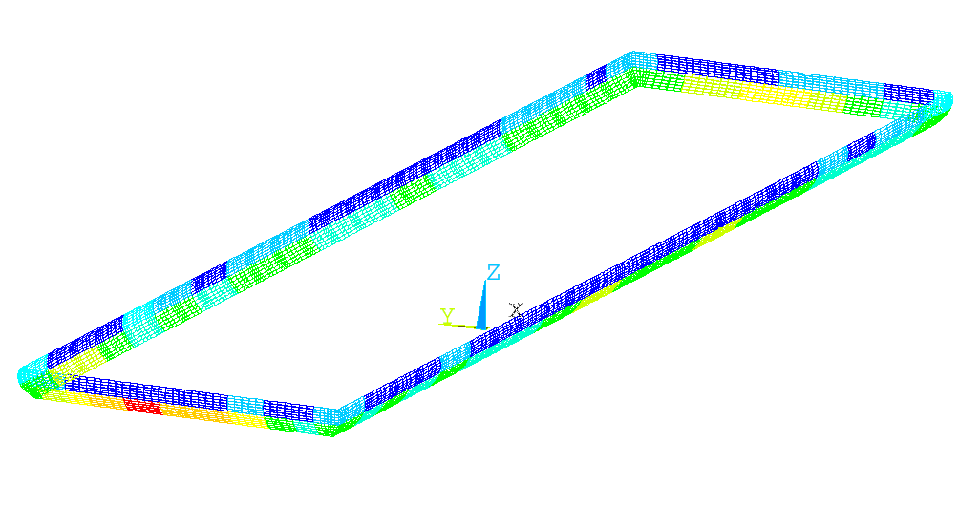
Up to now, the thermo-electric model and the MHD model were used completely independently. In the following run, for the first time, the velocity fields calculated by the MHD model in both the bath and the metal have been used to set up the local heat transfer coefficients at the liquids/ledge interface in the thermo-electric full-cell-cathode model (see Figure 16).

Due to time constraints in preparing this paper, however, the metal velocity field used is not the one presented in Figure 14, but rather a similar one from a previous run. The equations used to compute the local coefficient in this first interaction trial are:

(3)

(4)

where h is in W/m² °C and v is in m/s. As in the MHD model the velocity (v) is set to zero at the ledge surface, the velocity used in Equations (3) and (4) is the bulk fluid velocity in the immediate vicinity of the ledge surface. The idea of linear relationship with velocity, used in Equations (3) and (4), is taken from the experimental work in [9], but the coefficients are different. The coefficients 1841.5 and 1286.0 were selected in order to get average values identical to the constant values used before, as typical values of the heat transfer coefficients are estimated to be around 2000 W/m2K when using the cell liquidus superheat. The choice of the slope is quite arbitrary at this stage but 5000 (W/m2K)/(m/s) is barely large enough to really significantly affect the ledge thickness along the perimeter of the cell considering the relatively low velocities in the vicinity of that cell ledge perimeter. As reference, base on their experimental work, Nazeri and al. [9] are proposing a slope of 3360 (W/m2K)/(m/s). Unfortunately, experimental data, not available to the authors, would be required to establish a reliable correlation between the velocity fields in the vicinity of the cell ledge perimeter and the local heat transfer coefficients at the liquids/ledge interface.


The calculation of this model on the P4 computer took 32 CPU hours to build and solve 11 iterations of the ledge shape convergence scheme. The results are shown in Figures 17, 18 and 19.

Figure 16: Distribution of the local heat transfer coefficients at the metal/ledge and bath/ledge interface.

Figure 17: Thermal solution of the 3D full-cathode and external bus-bar thermo-electric model.

Future work

The obvious next step would be to use the ledge profile calculated by the full-cell cathode thermo-electric model and feed it into the MHD model. Work on this is in progress.


Figure 18: Voltage solution in the metal pad of the 3D full-cathode and external bus-bar thermo-electric model

Figure 19: Current density in the metal pad of the 3D full-cathode and external bus-bar thermo-electric model.

Conclusions

A 3D full-cell cathode and external bus-bar thermo-electric model was developed and successfully used in interaction with the MHD model to calculate the ledge profile all along the cell perimeter. The ledge profile convergence calculations took 32 CPU hours on a P4 3.2 GHz computer. Once again as before [3], a 3D full-cell and external bus-bar thermo-electric model could not be used to do the same. Yet this time, it is the ANSYS solver (software) rather than the P4 computer (hardware) that has been identified as the bottleneck. We hope that more recent versions of the ANSYS solver address the problems we reported in this work.

The MHD model has been improved to obtain a better representation for the shielding effect of the potshell. Future work is still required to include the computed turbulence effects in the heat transfer and ledge formation process in order to have the two models fully interacting with each other.

References

  1. M. Dupuis, V. Bojarevics and J. Freibergs, "Demonstration Thermo-Electric and MHD Mathematical Models of a 500 kA Al Electrolysis cell", Proceedings of the 42nd Conference on Light Metals, CIM, (2003), 3-20.

  2. M. Dupuis, "Thermo-Electric Design of a 500 kA Cell", Aluminium, 79 (7/8), (July/August 2003), 629-631.

  3. M. Dupuis, "Toward the Development of a 3D Full Cell and External Busbars Thermo-Electric Model", Proceedings of the 41st Conference on Light Metal, CIM, (2002), 25-39.

  4. M. Dupuis, "Using ANSYS to model aluminum reduction cell since 1984 and beyond", Proceedings of the ANSYS 10th International Conference, (2002), electronic format only.

  5. M. Dupuis, "Computation of Accurate Horizontal Current Density in Metal Pad using a Full Quarter Cell Thermo-Electric Model", Proceedings of the 40th Conference on Light Metal, CIM, (2001), 3-11.

  6. V. Bojarevics, K. Pericleous and J. Freibergs, "Modelling the Dynamics of Electromagnetically Agitated Metallurgical Flows". Proc. Int. Symp. Liquid Metal Processing and Casting, ed. A. Mitchel and J. VanDenAvyle, (American Vacuum Society, Santa Fe (USA), 2001), 46-60.

  7. J. Freibergs, "Optimisation of MHD Processes in an Aluminium Reduction Cell", Proc. Int. Colloq. 'Modelling Material Processing', (Riga, Latvian University, 1999), 86-91.

  8. V. Bojarevics and M.V. Romerio, "Long Wave Instability of Liquid Metal-electrolyte Interface in Aluminium Electrolysis Cells: a Generalization of Sele's Criterion", Eur. J. Mech., B/Fluids, 13 (1) (1994), 33-56.

  9. H. Nazeri, T.A. Utigard and P. Desclaux, "The Measurement of Heat Transfer Coefficient between Cryolite and Ledge", CIM Light Metals, (1994), 543-559.